

AARP Eye Center


Changing With the Times: Visualization Is the Future of Data
By Becky Gillan, November 22, 2013 11:26 AM
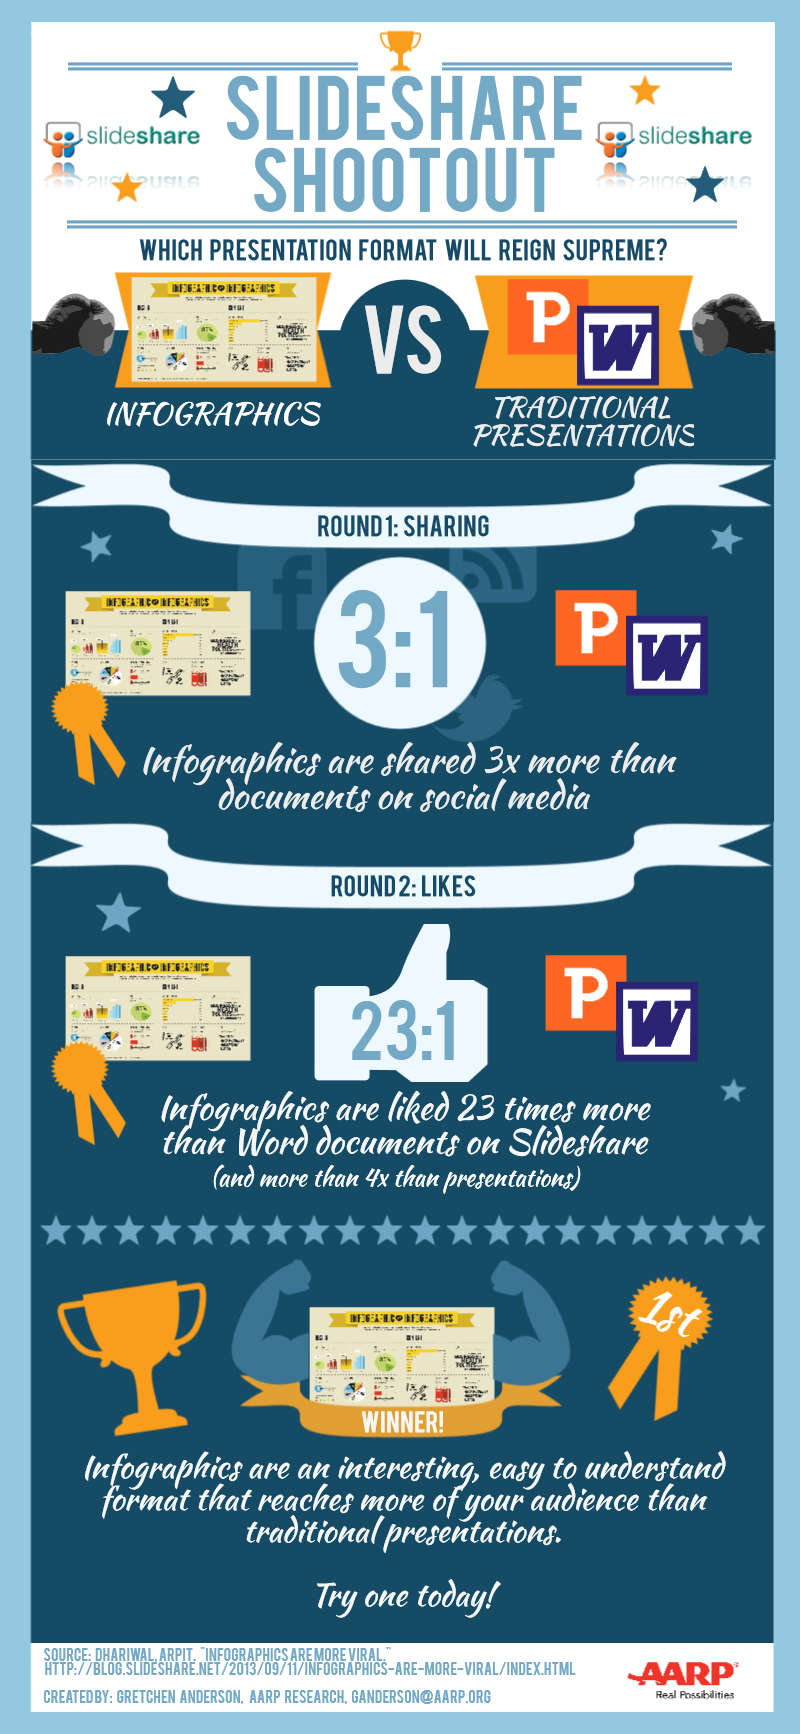
Slideshare is a popular website where people can post presentations on a myriad of topics. By posting, the authors hope to get readers, followers and new clients. To test popularity, in July of this year, Slideshare launched an infographic section on the site. The verdict is in and very compelling - look at the infographic below! On Slideshare, infographics are liked 23 times more than Word documents.
In AARP Research, we have been able to train over half of our department on infographic design in the past year. As head of Research, I felt it had to be an embedded skill just like learning PowerPoint was 20 years ago. AARP Research now creates an infographic with every major survey we do, and we have done 60 so far this year (versus none last year!). We post our infographics here on the blog and on our website, and our state directors even post them at events so that attendees can focus on key facts.
Visual and simple means that new audiences are learning about the issues that are important in the lives of those 50 years and older. Who wants to read a 100-page report except me?
Becky Gillan is senior vice president of AARP Research and is focused on fostering understanding of the interests and concerns of people age 50-plus and their families. Before coming to AARP, Becky served as vice president of Global Market Research & Guest Satisfaction for Starwood Hotels & Resorts. In her spare time, she likes visiting her niece in Ohio, gardening and collecting American art and antiques.