AARP Hearing Center
OLDER VOTERS’ MOOD AND CONCERNS: A COMPLICATED PICTURE
By Nancy A. LeaMond, February 14, 2023 11:03 AM

Last week, President Biden delivered his State of the Union address to a divided Congress – and a divided nation – and it already feels like the 2024 election is right around the corner.
It’s much too soon for prognosticating. As the saying goes . . . eighteen months is a lifetime in politics. And, more and more, our politics seem to be predictably unpredictable.
But, one thing is clear: older voters, and particularly older women, remain the critical group to watch.
As a reminder . . . voters age 50 and over made up the majority of the electorate in 2022, and an AARP survey of battleground Congressional Districts found that 65+ voters, especially women, made the difference limiting Republican gains in the House.
The latest AARP research in our She’s the Difference series paints a very nuanced picture of how these voters are feeling and what they care about coming out of the 2022 elections.
In short . . . it’s complicated.
The same party divide that we see in the electorate writ large, exists with the 50+ as well, coloring their views on the economy, democracy and the top issues facing the country.
For example, Republican 50+ voters overwhelmingly see the country as on the wrong track (94%), say America’s best days are behind us (72%), and believe the U.S. economy is not working well for them personally (72%). Meanwhile, 50+ Democrats are far more positive, with 62% saying the country is going in the right direction, 59% seeing America’s best days still to come, and 68% feeling the economy is working well for them personally.
Despite this, voters 50+ across party lines feel more positive about their own situations, assessing their own lives differently than they assess the country.
While only a handful (5%) of voters say America’s best days are “happening now,” over a quarter (28%) say their own best days are happening right now. There is not much difference by party; about as many Republicans and Democrats agree (26% and 31%, respectively).
Many older voters are still anxious about their economic situation.
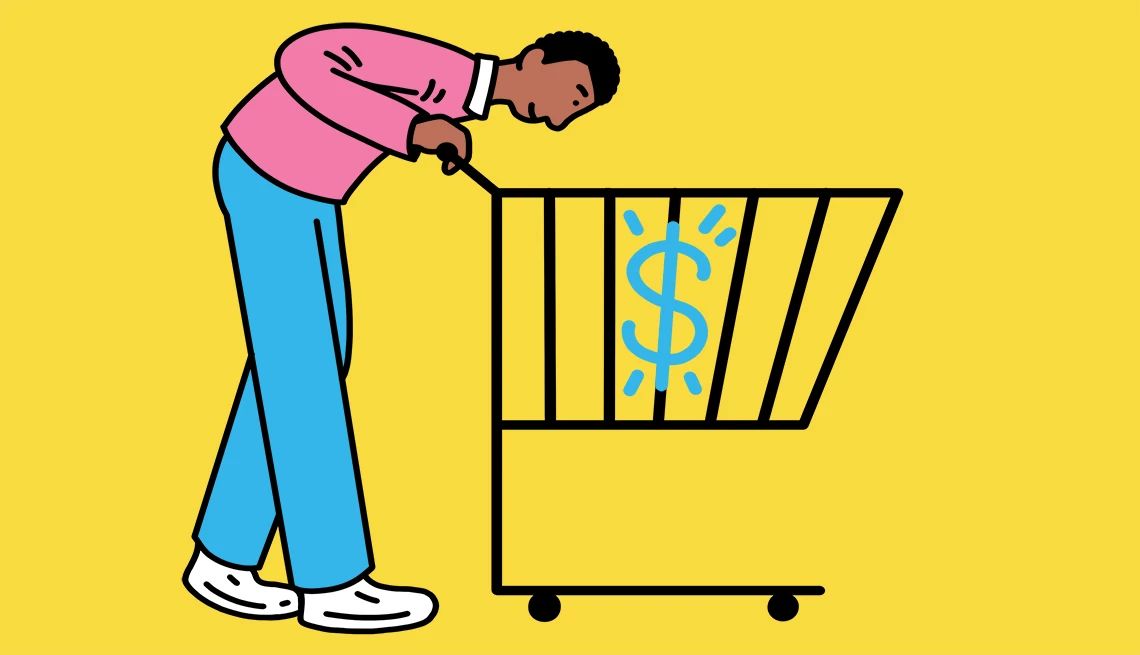
While a majority report they can afford their expenses, or even call their own financial situation “secure” (65% secure, 35% not secure), costs and inflation continue to be a pressing worry and a top-tier concern about the country. “The cost of food, gas, and everyday goods,” is voters’ top concern about the country (45% “one of the biggest problems,” 89% “one of the biggest” or “major” problem). And in a series of personal worries—as opposed to national problems—“my income keeping up with rising costs” also tops the list (30% “very worried,” 73% total worried).
Women consistently feel more economically vulnerable than men.
More men than women say they’re living “comfortably” (39% men, 29% women). More women than men say they are less financially secure than they expected to be at this time of their lives (48% women, 39% men). More women than men say they’re “very worried” about their income keeping up with costs (34% women, 25% men). And fewer women than men say their personal financial situation feels secure (62% women, 69% men).
These gender differences largely transcend party and are magnified by age. Across party lines, women are more likely than their male counterparts to say they are less financially secure than they expected to be. Republican women feel particularly less secure (53%) compared to Republican men (44%), but there is a similar gap among Democrats (42% women, 32% men) and independents (49% women, 35% men). On this same question, women 65+ feel less secure than men 65+ (42% women, 29% men), much like women 50-64 feel less secure than men of a similar age (53% women, 47% men).
Financial strain is also more likely to be felt by caregivers, both current and former.
Current and past caregivers are less likely to say their financial situation is “secure” (58% and 62%, respectively) than non- caregivers (68%). Nearly two-thirds (64%) of current caregivers are “very” or “somewhat” worried about their family’s financial situation, while only 54% of non-caregivers and 57% of former caregivers say the same. And more caregivers say they feel less financially secure than they expected to be at this stage in life (46% current, 48% former) in comparison to non-caregivers (41%).
Retirement evokes a mix of worry and optimism, with the stability of Social Security and Medicare and access to long-term care all top-of-mind concerns.
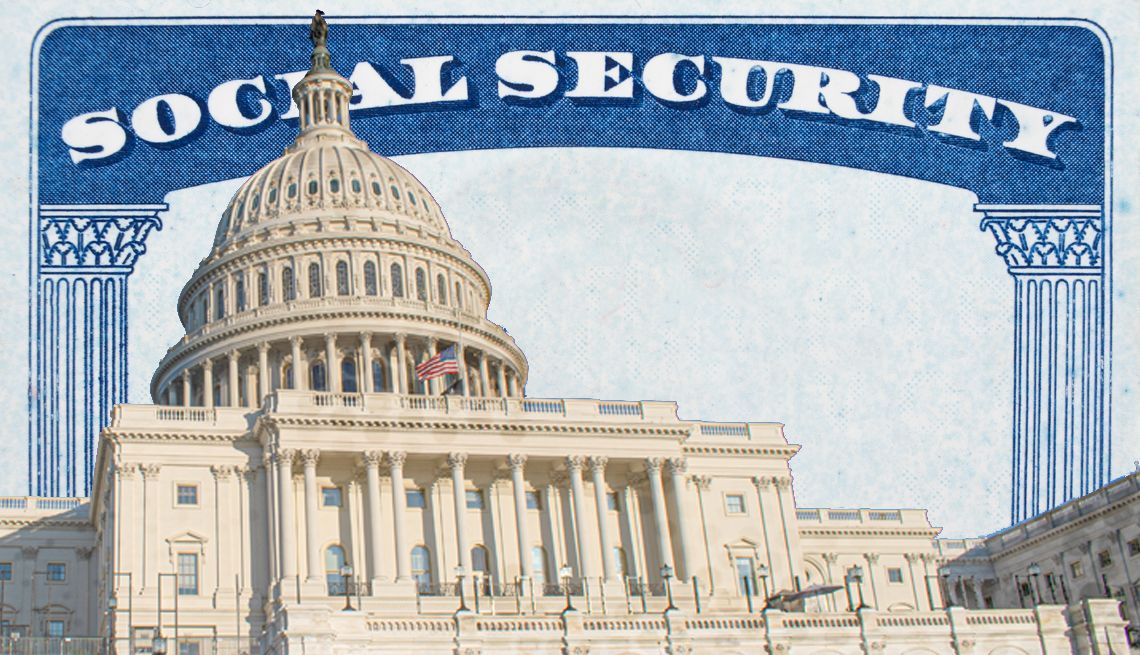
A majority of 50+ voters say they worry about “the ability to live independently as I age” (61%). About as many (60%) are worried about affording their retirement and about Social Security being there during their retirement (58%). And, large majorities see long-term care for seniors and Medicare and Social Security being there for future generations as major problems facing the country. An overwhelming 83% say Social Security/Medicare is one of the biggest or a major problem, putting it in the top-tier of national issues.
Despite these concerns, nearly six in 10 voters 50+ are upbeat about their current situation or the future.
Those feeling their best days are ahead of them (31%) say they’re looking forward to retirement while those whose best days are happening now (28%) are enjoying good health and financial security in retirement.
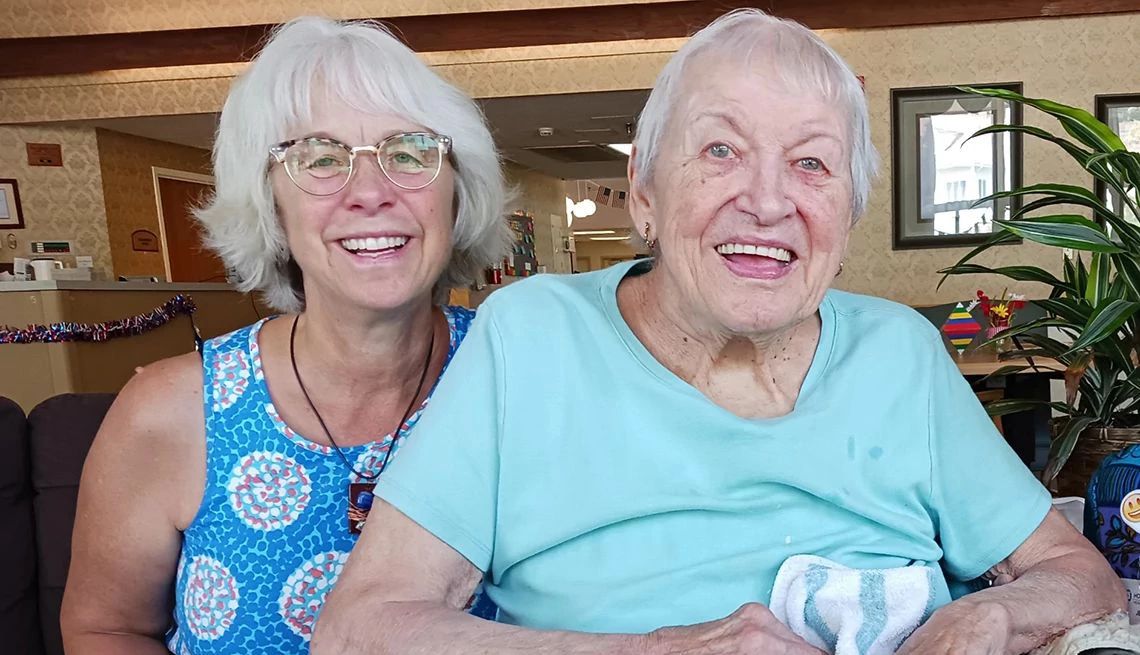
In fact, the most heartening result in our survey – and maybe the entire 2022 “She’s The Difference” effort – is the widespread feeling of satisfaction and happiness voters age 50+ feel about their lives. Voters overwhelmingly tell us phrases like “I feel good about myself,” “I mostly enjoy my life,” and “I have meaning and purpose in my life” describe them personally.
So, the one thread tying all this together seems to be that it’s possible to feel both wary and happy at the same time, especially for older women. In the weeks and months to come, we’ll be keeping a close eye on this cohort . . . as should policymakers and anyone looking ahead to the 2024 campaign cycle.


