

AARP Eye Center


Working Toward More Livable Communities
By Susan Reinhard, June 13, 2018 03:18 PM
Will the community in which you live now continue to meet your needs in the years ahead? The AARP Public Policy Institute (PPI) has a powerful tool to help you answer that question, and even become a catalyst for local change.
At AARP and within PPI, we’re working to ensure more livable communities for everyone. That’s more important than ever, given that people are living longer than at any time in history, and that by 2035 older adults will outnumber children for the first time in U.S. history.
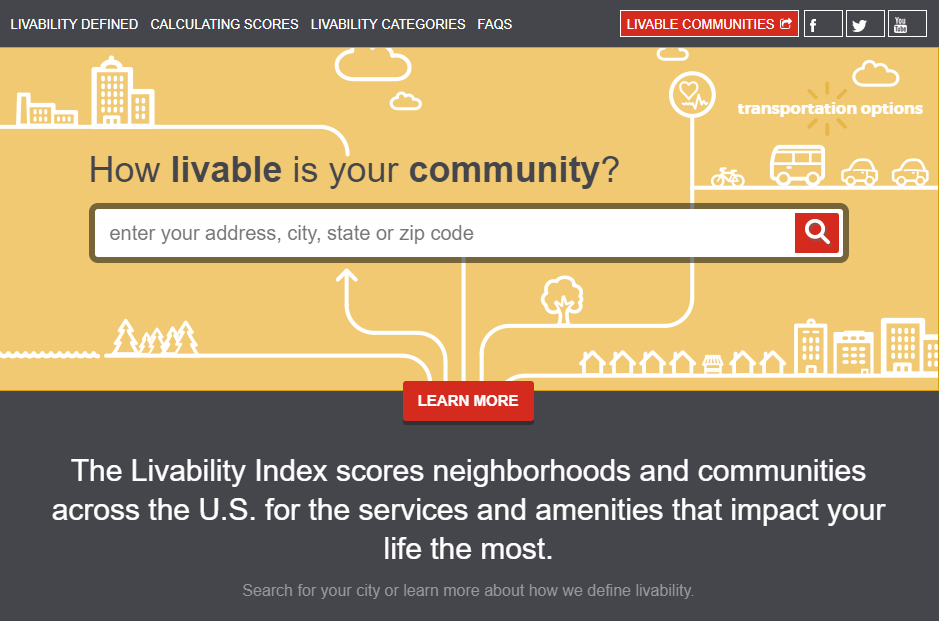
Our groundbreaking Livability Index, which measures livability across the nation, is a cornerstone of that work. The web-based, interactive tool, built from the ground up through consultation with some 30 experts in various disciplines and discussion with consumers about what makes a community “livable,” launched in April 2015. It can be used by anyone, from policy experts and decision makers to members of the public who want information about where they live. With the simple input of a home address or other information, the tool instantly kicks out a wealth of information: an overall livability score for a given community as well as scores for each of seven major livability categories (in bold, below). The Index also looks at 40 metrics (4-7 per category) and 20 policies across the seven categories.
What makes the Index truly unique is that it drills down all the way to the neighborhood level rather than provide a score only for an entire city or other jurisdiction. (It can give you an entire city, county, or state’s scores as well.) Why create a tool with that level of precision? In short, to empower people to make their communities better. Communities, after all, are about a resident’s immediate surroundings.
“People care about their communities,” observes PPI Director of Livability Thought Leadership Rodney Harrell, a leading authority on livability and the person who oversaw the creation of the Index. “The Livability Index gives them a performance baseline—a jumping-off point for conversation with other community members and leaders.”
The Index also syncs with other AARP work, even helping to drive success. Since the Index launched three years ago, AARP has continued to promote several policies to foster livable communities. Several have been adopted across the country, such as establishment of housing trust funds, which expand or preserve affordable housing options.
In addition to housing, the Index examines a range of categories, transportation among them. Does a community, for example, have policies in place that make streets safe for all to use? And are a range of transportation options available to meet a diverse range of needs? There’s also the environment to consider: Does a community have clean air and water, as well as a disaster preparedness plan? And then there are the neighborhoods themselves—access to parks, libraries, work, transit, and so forth. Other categories the Index measures: health, opportunity, and engagement.
Many cities, meanwhile, have signed on to AARP’s Network of Age-Friendly States and Communities, part of an international effort launched in 2006 to help cities prepare for the rapid aging of the population, or have adopted Complete Streets policies, which increase safety and accessibility for all.
In many ways, therefore, the Livability Index is a hub of all this important AARP work, and that’s why we’re about to make the tool even better. I’m excited to report that we’ll soon release a Livability Index update. Among other improvements, we’re in the process of updating various metrics and policy measures. For example, we’ve updated metrics associated with housing and transportation accessibility, such as zero-step entrances and buses, as well as trains and stations that accommodate wheelchair users (or that are ADA compliant).
When we re-launch the site on June 21, we’ll also introduce some new features.
One such feature is “Tracking Livability Progress Over Time.” As Harrell explains, “The tool will show 2015 side-by-side with 2017 and 2018 so you can get a clear picture of what’s changed over that period in your neighborhood.” Those changes can range from new libraries to housing cost increases. In other words, a person can find out if a locale is making progress.
I encourage you to check out the Livability Index and interact with it, especially following the June 21 update launch. Some of you may find this useful as it relates to your own work. And everyone can see if their own community—or one they’re considering for the future—can provide the kind of livability they desire and need, now and in the future. And if your community needs some work (and most do), perhaps you’ll be a catalyst for change.
We’d love to hear what you think of the user experience, which is why we’re adding a Feedback section to the Index. Until then, feel free to post feedback here as well.
Search AARP Blogs
Recent Posts