

AARP Eye Center


Tax Day Special: How Much of the Income Tax Pie Do Older Americans Contribute?
By Debra Whitman and Maxin Shvedov, April 13, 2017 03:49 PM
Getty Images/iStockphoto
By midnight on April 18, millions of Americans will have hit the File button in their tax preparation apps or dropped their tax returns in the mail. With 2017 tax season almost behind us, it’s a good time to take a look at taxes as they relate to Americans over 50 — specifically, older Americans’ impact on the federal coffers as well as the impact taxes have on their own wallets. And there’s another reason to look at this issue now: In the coming months, tax reform promises to be a hot topic of discussion in Washington, D.C.
Big contributors
Taxpayers 50 and older are big contributors to the federal budget. As chart 1 shows, households headed by a person over 50 paid 60 percent of all federal individual income taxes in 2013. That amounts to $778.9 billion of the $1.3 trillion total federal income tax collected. To put that in perspective, in fiscal year 2013, this money could cover total federal spending on national defense, elementary and secondary education, environment conservation and protection, agricultural programs, scientific research, and space exploration — some of the key government functions helping all Americans live better, more secure lives.
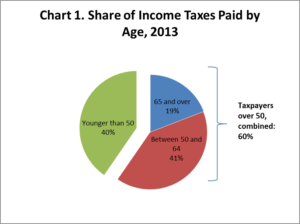
Source: AARP’s Public Policy Institute calculations based on the data in Statistics of Income, IRS — Tax Year 2013 Individual Complete Report, December 2015.
Taxpayers between 50 and 64 years of age were the biggest contributors to the federal income tax pie, paying 41 percent of all taxes. Taxpayers 65 and over paid about half as much, 19 percent, but they were the smallest of the three age groups. The youngest group of taxpayers (under 50) paid 40 percent of the total federal income tax. This group, however, was the largest in size — larger, in fact, than the other two combined.
Story on the ground
Now let’s swoop down from the bird’s-eye view to get the story on the ground — that is, from the perspective of a taxpayer. On average, older taxpayers paid considerably more than taxpayers in the youngest age group. Chart 2 shows that taxpayers 65 and older paid over $10,000 on average (calculated as a mean), and taxpayers in the 50-to-64 age group paid almost $15,000. By comparison, taxpayers in the youngest age group paid about $6,000. Other metrics, such as median tax, might dull the contrast somewhat, but the main conclusion would likely stay unchanged.
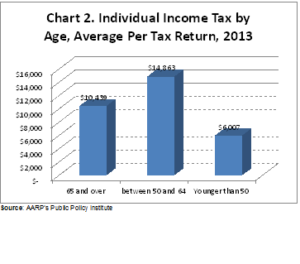
Source: AARP’s Public Policy Institute calculations based on the data in Statistics of Income, IRS — Tax Year 2013 Individual Complete Report, December 2015.
The interdependence of ages
As we say goodbye to another tax season and prepare for a national tax reform discussion, examining these tax statistics is important both in terms of public awareness as well as for policy makers. For the general public, it is a reminder that taxes do not magically disappear once you hit 65. Many retirement income sources, such as Social Security or 401(k) withdrawals, may be taxed. It is critical, therefore, for workers of all ages to take future tax burden into account when saving for retirement and when planning a withdrawal strategy once retirement arrives. For policy makers, meanwhile, it is a reminder of older taxpayers’ major contribution to federal coffers.
But this is not a call for intergenerational conflict. Taxpayers over 50 pay more, on average, as this is often the peak earning period of their lives. Older adults also receive substantial benefits from federal programs, most notably Social Security and Medicare, which are financed to a great degree by taxes paid by younger workers.
This full circle of contributions and benefits only underscores the natural interdependence between people of all ages that is so critical in a cohesive society. Moreover, today’s seniors are yesterday’s young, while today’s young are tomorrow’s seniors. Over the course of everyone’s life there are periods when a person pays more in taxes and periods when a person pays less. This is why ability to pay taxes, not age, should continue to be the key factor in guiding our tax policy.

Debra Whitman is AARP’s chief public policy officer and leads policy development, analysis and research, as well as global thought leadership that supports and advances the interests of individuals age 50-plus and their families. Follow Deb on Twitter: @policydeb

Maxim Shvedov is a senior strategic policy adviser at AARP’s Public Policy Institute. He works on tax and budget issues at the federal and state levels.
NOTES for both Chart 1 and Chart 2: Some households (tax units), such as married couples, may represent more than one taxpayer. When spouses belonged to different age groups, they were assigned to an age group based on the age of the older spouse. E.g., a couple with spouses age 67 and 64 were assigned to the 65-and-over group. Due to differences in methodology and other factors, these statistics may not be comparable to other data published by the Statistics of Income Division. Details may not add to totals because of rounding.
Search AARP Blogs
Recent Posts