

AARP Hearing Center


Using Data to Disrupt Health Disparities: Lessons Learned from the Coronavirus Pandemic
By Beth Carter, Edem Hado, November 9, 2020 01:43 PM

andresr/Getty Images
Eight months into the coronavirus pandemic, it’s clear that COVID-19 is impacting some communities much more severely than others. We know, for example, that members of the Black, Hispanic, and Native American communities are far more likely to experience severe illness and death from many health conditions, including COVID-19.
To reduce these health disparities, state public health departments and health care systems need to start by compiling robust data, and providers and policymakers need to act on it. Yet that much-needed information, unfortunately, all too often falls short, with some states collecting data better than others. Public reporting of COVID-19 data by race and ethnicity has revealed troubling patterns, including incomplete information, missing data, and inconsistencies in labeling racial and ethnic groups.
Since the pandemic’s onset, the AARP Public Policy Institute has been tracking how states report COVID-19 data by race and ethnicity. Sure enough, we found a wide variability in their reporting. From our findings, we identified the following best practices state public health officials can use in publicly reporting race and ethnicity data in the context of COVID-19. And, in fact, these practices have implications well beyond pandemic-related data collection.
1. Use U.S. Census race categories. The first step is for states to ensure categories are at least minimally comprehensive. By omitting certain racial categories we cannot determine the burden of disease in those populations. Native Americans, for example, are especially hard hit by COVID-19, yet nearly half the states (47%) do not even include American Indian/Alaska Native as a racial category in their reports. We found one state that only reports COVID-19 statistics for the racial categories of Black, White, Other, and Unknown. A good place to start for developing categories is the U.S. Census Bureau, which adheres to the Office of Management and Budget (OMB) standards on race and ethnicity in requiring the following five categories, at minimum, allowing for an ‘Other’ category (Figure 1):
- African American or Black
- American Indian or Alaska Native
- Asian
- Native Hawaiian or Other Pacific Islander
- White
Figure 1: Example of U.S. Census Race Categories and Reporting Race and Ethnicity as Separate Variables
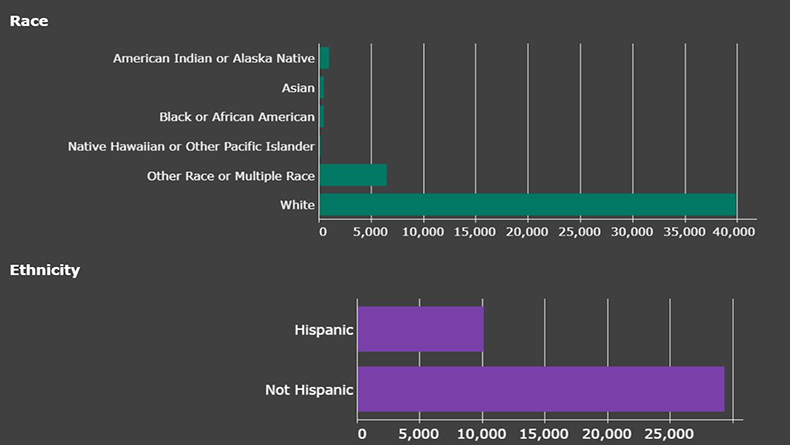
Source: Idaho Division of Public Health COVID-19 Dashboard. Accessed November 9, 2020.
2. Report race and ethnicity as separate variables. Race and ethnicity are distinct constructs. Because people who identify as Hispanic or Latino can be of any race, it is important to treat race and ethnicity as two separate variables. Including Hispanic as a racial category obscures the true racial breakdown of COVID-19 data. Idaho separates race and ethnicity into two separate variables on its COVID-19 dashboard (Figure 1).
3. Report rates per 100,000 people, not just raw numbers. Raw case and mortality numbers do not tell the whole story. Without denominators, valid comparisons between groups cannot be made. For example, as of November 9, 2020, Kansas reports 852 COVID-19 deaths among Whites and 107 among Blacks. On first glance, it seems the burden of COVID-19 is much greater among White residents in the state (Figure 2). However, with Kansas’s White population being considerably larger than its Black population, the broader numbers need to be taken into account. Once this is done, the data reveal a stark reality: a Black individual is 1.5 times as likely as a White individual to die from COVID-19 (49.1 deaths per 100,000 among Black residents in the state versus 33.5 deaths per 100,000 among White residents).
Figure 2. Example of Reporting Both Raw Numbers and Rates per 100,000
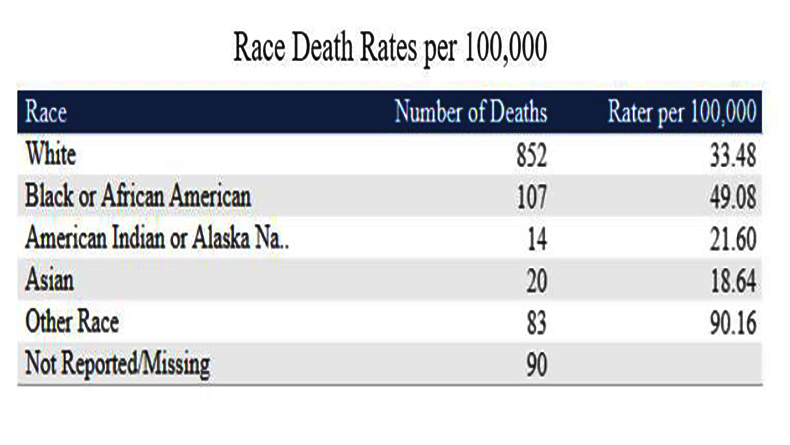
Source: Kansas Department of Health and Environment COVID-19 Dashboard. Accessed November 9, 2020.
4. Report levels of missing data. When reviewing data, what’s not there is just as important as what is. If a state has large numbers of cases and deaths involving people with unknown race and ethnicity, the numbers the state does report need to be interpreted with caution. The Pennsylvania COVID-19 dashboard, for example, reports that 12 percent of COVID-19 cases in that state are among Black individuals. But Pennsylvania officials know the race of only slightly more than half (56%) of their cases (Figure 3). If a large proportion of the 101,604 cases with unknown race are actually among Black individuals, the current statistics misrepresent the reality on the ground. Thus, knowing the level of missing data is key to understanding the numbers, and so jurisdictions should be sure to report what’s missing in order for users of the data to understand the full picture.
Figure 3. Example of Reporting Missing Race Data
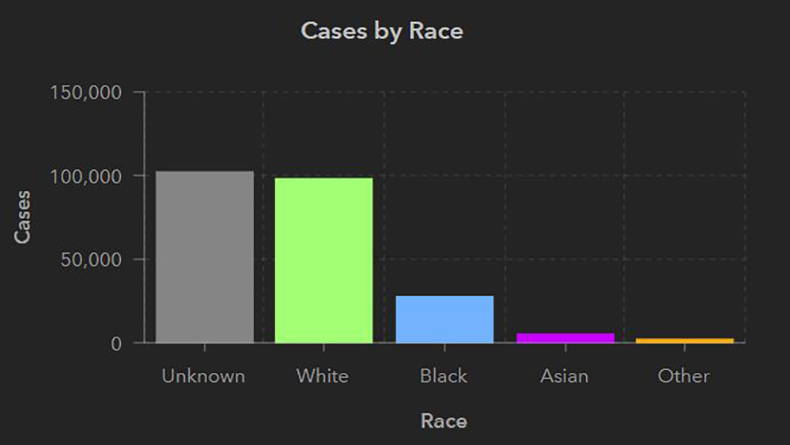
Source: Pennsylvania COVID-19 Data Dashboard. Accessed November 9, 2020.
Robust Data Needed for Good Policy
Knowing the full impact of the coronavirus in specific sub-populations is the necessary first step in responding to this pandemic. At a minimum, demographic data must be collected for every person tested for the coronavirus, as well as for all COVID-19 cases, hospitalizations, and deaths.
Michigan officials, for example, realized early on in the coronavirus pandemic that people of color in their state were being disproportionately impacted. Despite making up only 14 percent of Michigan’s population, Black individuals accounted for over one-third of confirmed COVID-19 cases and 40 percent of deaths. This information was crucial in helping the state understand the pandemic and developing tactics to handle it. With help and input from the AARP Michigan state office, Michigan formed the Coronavirus Task Force on Racial Inequalities. Formed by Governor Gretchen Whitmer in April and led by Lt. Governor Garlin Gilchrist, the Task Force took immediate actions such as using social media to target information to communities of color and increasing testing sites in locations where disparities were most pronounced. The tactics have gotten results. Since August, the daily rates of new cases and deaths for Black residents has been equal to or lower than those for White people.
As the Michigan example illustrates, robust and timely data are essential for detecting and mounting responses to health disparities. Researchers, providers, and policymakers need comprehensive and complete race and ethnicity data in order to detect such disparities, not just for COVID-19, but for other serious health conditions, such as diabetes, cancer, and heart disease. Regardless of the health issue, such data will identify where racial and ethnic disparities exist, help determine if resources are being equitably distributed, and guide and support data-driven policies and interventions.


Search AARP Blogs
Recent Posts